Want to know how to read candlestick charts for day trading as well as swing trading & investing?
If you’re stepping into the world of stock market trading, understanding candlestick price charts is a crucial skill. These charts offer a visual representation of price movements and can be a powerful tool for informed decision-making. Let’s delve into the art of reading and trading with candlestick charts.
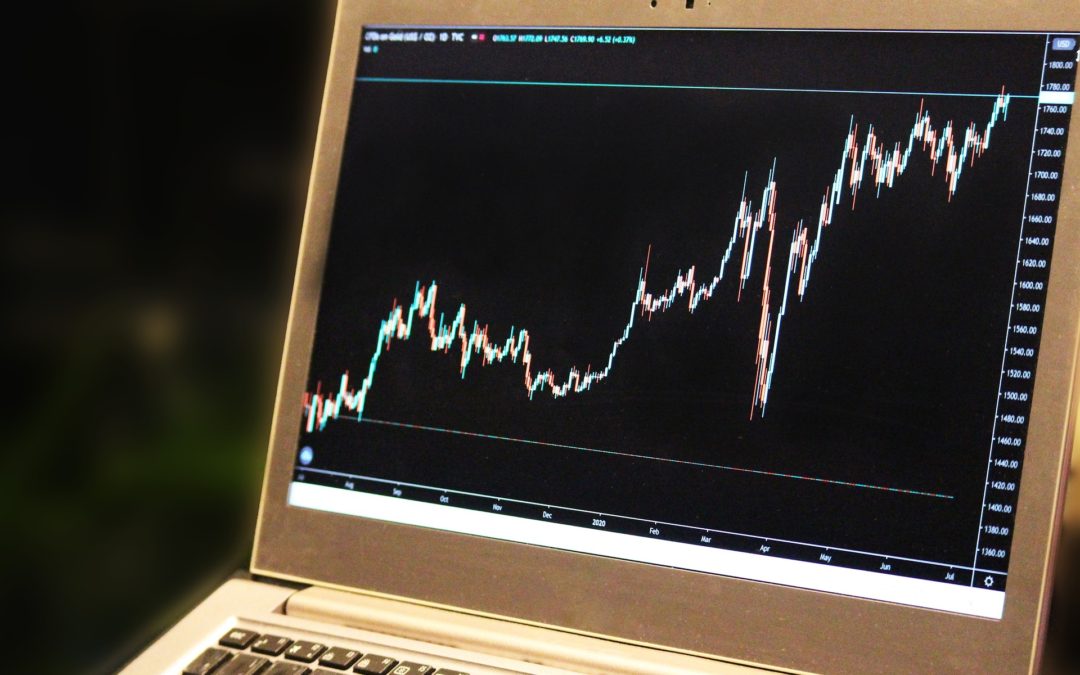
What are Candlestick Charts?
Candlestick charts are a popular method used in technical analysis to represent the price movements of an asset. Each candlestick typically shows the Opening, Closing, High, and Low prices within a specific time frame, offering insights into market sentiment.
The Anatomy of a Candlestick
- Body: The rectangular area between the opening and closing prices. A filled (or red) body indicates a bearish trend, while an empty (or green) body signifies a bullish trend.
- Wicks (or Shadows): The thin lines above and below the body. They represent the highest and lowest prices during the given time period.
Interpreting Candlestick Patterns
- Bullish Engulfing Pattern: Indicates a potential reversal from a downtrend to an uptrend.
- Bearish Engulfing Pattern: Suggests a potential reversal from an uptrend to a downtrend.
- Doji: Signifies market indecision and potential trend reversal.
- Hammer: A bullish reversal pattern often seen at the bottom of downtrends.
- Shooting Star: A bearish reversal pattern occurring at the peak of an uptrend.
Why Use Candlestick Charts?
- Visual Clarity: Candlestick charts offer a clearer representation of price movements compared to traditional bar charts.
- Trend Identification: Easily identify trends and potential trend reversals.
- Decision-Making Aid: Assist in making informed decisions about buying or selling based on market sentiment.
Tips for Reading & Trading with Candlestick Charts
- Understand Candlestick Patterns: Familiarize yourself with common patterns and what they indicate.
- Consider Time Frames: Different time frames reveal different insights. Choose a time frame that aligns with your trading strategy.
Conclusion
How to make money trading with candlestick charts?
Reading candlestick charts is an invaluable skill for traders, providing a nuanced understanding of market dynamics. Whether you’re a beginner or an experienced trader, learning candlestick analysis can significantly enhance your ability to navigate the markets.
Take the time to learn and practice reading candlestick charts, and empower yourself to make more informed trading decisions.
Attend our upcoming Demo Workshop for just Rs. 98/- to learn how to read charts based on Price Action Trading and make trading decisions. Click here: https://www.tradingstyle.in/stock-market-seminar